Tracking My AI Usage Limits in Home Assistant
I run my coding life across two AI plans — Claude Code on an Anthropic Pro subscription, and the z.ai GLM Coding Plan — and both of them enforce the same kind of rolling usage limits: a five-hour window and a weekly window. The trouble is that those windows reset on their own clocks, not mine. I’d be deep in a refactor, hit a wall, and only then discover I’d burned through my five-hour allowance. Or I’d baby my usage all afternoon, scared of a limit I was nowhere near hitting.
Half the problem was simply not knowing where I stood. Anthropic shows your usage on a web page somewhere; z.ai shows it on another. Neither is somewhere I look. So I built what I actually wanted: a single Home Assistant dashboard — one I can glance at on my phone’s home screen — that shows both providers’ limits side by side, updated every few minutes.
What these limits actually are#
If you use Claude Code or a similar coding agent on a subscription, you will recognise this. Instead of paying per token, you get a rolling allowance. Anthropic’s Pro plan gives you a five-hour session window and a weekly window; when either fills up, you get throttled — slower responses, queued requests, or a polite message telling you to wait. The z.ai GLM Coding Plan works the same way: a five-hour token window and a weekly one, with the throttle kicking in when you cross the line. I wrote about why I run both plans — and how z.ai’s Anthropic-compatible API lets one tool speak to either — in my post on building an AI toolkit beyond ChatGPT .
The useful thing about a percentage is that it tells you something a raw number never could: how close am I to being slowed down? Fifty thousand tokens means nothing without context. Forty-seven percent of your five-hour window means “keep going, you’re fine.” That is the whole point of the dashboard — translate the quota into a number I can act on.
Two halves, one easy and one not#
The project split cleanly in two. The Claude side was already solved. There are a couple of community integrations that publish Claude Code usage into Home Assistant — a native “Claude Usage” HACS integration, and ccusage-mqtt , a small process that publishes the numbers as MQTT sensors. I was already running one of these, so I had the Claude five-hour percentage, the weekly percentage, the reset times, and a weekly pace figure as sensors in Home Assistant. That half was done.
The z.ai half was not. There is no Home Assistant integration for the GLM Coding Plan, and z.ai’s usage endpoints are not exactly famous for their documentation. So that became the actual project: query the z.ai API myself, turn the responses into sensors, and lay them out next to the Claude ones on a single dashboard.
Reverse-engineering the z.ai API#
This was the fun part. I started by watching what the official tools do. z.ai ships a usage tracker inside their VS Code extension, and I had already written a small statusline script that fetches these numbers for my terminal. Between those two reference points I knew the endpoints existed — I just had to pin down exactly how the responses were shaped.
A single curl against the quota endpoint with a Bearer token came back HTTP 200, which was encouraging. z.ai’s API lives under https://api.z.ai and wraps everything in an envelope:
{ "code": 0, "msg": "success", "data": { ... } }Two endpoints do all the work:
| Endpoint | What it returns |
|---|---|
/api/monitor/usage/quota/limit | The live quota windows — five-hour and weekly percentage, MCP tool-call counts, reset times, and your plan tier |
/api/monitor/usage/model-usage | Rolling totals — prompt count and token count over a window you specify |
Auth is HTTP Bearer, same as the rest of z.ai. Easy enough. The interesting problems were both hiding inside the first endpoint.
Gotcha one: two windows that look identical#
The data.limits array contains a handful of entries, and the five-hour and weekly windows are not distinguished by name. They are both TOKENS_LIMIT objects. The only thing telling them apart is a numeric unit field — 3 for the five-hour window, 6 for the weekly one.
If you reach for “the” TOKENS_LIMIT — say, the last one in the array, which is what a lazy parser grabs — you silently get the weekly value everywhere you wanted the five-hour one. Your dashboard looks plausible and is completely wrong. I knew to look for this because I had hit the exact same bug a few weeks earlier in the statusline script: the gauges were reading weekly numbers and I could not figure out why my “five-hour” reading never seemed to reset every five hours. Same root cause. Filter on unit, every time.
Percentages, not counts — and that is the point#
Let me head off a natural assumption, because it shapes the whole design. The quota windows on z.ai come back as percentages, not raw token counts — and that is not a limitation I worked around. It is exactly what I wanted. A raw token total means nothing on its own. “You have used 152 million tokens this window” only becomes useful the instant you divide it by the ceiling, and at that point what you are reading is a percentage anyway. Forty-seven percent of your five-hour window tells you “keep going, you are fine”; a bare token count tells you nothing. The number that matters — how close am I to being throttled? — is a ratio, so the API handing back the percentage directly is the design meeting the requirement, not a compromise.
The raw counts do exist, on a different endpoint and for a different question. The model-usage endpoint will tell you that over the last seven days you made around 1,900 prompts and burned through roughly 150 million tokens. That makes a nice line in a details card — “how much have I actually used” — but it carries no ceiling, so it says nothing about your limit. The one place z.ai pairs a used value with a hard cap is MCP tool calls: a current count and a ceiling of, say, 1,000, which is why the dashboard shows “70 of 1,000 calls” there. For the token windows, though, a percentage is the right shape — and it is the shape z.ai chose to give.
Building the sensor package#
The whole z.ai side is one Home Assistant package file using the REST platform — twelve sensors fed by three resources, polled every 300 seconds. The key techniques are all visible in this trimmed excerpt:
rest:
  # The quota endpoint: 5-hour + weekly percentage, MCP calls, reset times
  - resource: https://api.z.ai/api/monitor/usage/quota/limit
    method: GET
    headers:
      Authorization: !secret zai_api_key      # stored as "Bearer <key>"
      Accept-Language: en-US,en
    scan_interval: 300
    sensor:
      - name: "z.ai 5h Quota Used"
        unique_id: zai_5h_quota_percent
        unit_of_measurement: "%"
        value_template: >-
          {% set L = (value_json.data.limits | default(value_json.limits, true)) | default([]) %}
          {% set p = L | selectattr('type','eq','TOKENS_LIMIT')
                       | selectattr('unit','eq',3)            # 3 = 5h, 6 = weekly
                       | map(attribute='percentage') | list %}
          {{ p[0] if p else None }}

  # Rolling 7-day window — raw counts ARE available here, unlike the quota windows
  - resource_template: >-
      https://api.z.ai/api/monitor/usage/model-usage?startTime={{ (now() - timedelta(days=7)).strftime('%Y-%m-%d') ~ '%2000:00:00' }}&endTime={{ now().strftime('%Y-%m-%d') ~ '%2023:59:59' }}
    method: GET
    headers:
      Authorization: !secret zai_api_key
    scan_interval: 300
A few details worth pointing out. The API key never lives in the package — it sits in secrets.yaml as zai_api_key: "Bearer <key>" and is pulled in with !secret, so the file is safe to share. Every template reads .data first and falls back to the top level, because the envelope shape is not perfectly consistent across endpoints and I did not want a format tweak on z.ai’s end to blank out my sensors. And the rolling windows use resource_template so the start and end times are computed fresh on every poll with now() - timedelta(...), which means the “last seven days” is always genuinely the last seven days.
The weekly sensor is identical to the five-hour one with unit: 6 instead of unit: 3. MCP tool-call usage and limit come from the TIME_LIMIT entry. Reset timestamps arrive as epoch milliseconds and get converted with timestamp_local. Twelve sensors, all told, covering the five-hour and weekly percentages, the three reset times, the MCP call counts, the plan tier, and the seven- and thirty-day prompt and token totals.
One number to get right: the poll interval#
Both providers are polled every 300 seconds — five minutes — and that number is load-bearing. It is tempting to poll faster for a “live” feel, and you should not. Anthropic rate-limits its usage API aggressively. Poll it too often and you get backed off for something like twenty-four hours, and that backoff does not just blank your dashboard — it throttles Claude Code itself, the claude.ai web app, and any other integration touching the same account, all at once. z.ai throttles too, more gently. Five minutes is the floor that keeps everything happy and keeps the two providers’ history graphs lined up on the same axis. Leave it alone.
The dashboard#
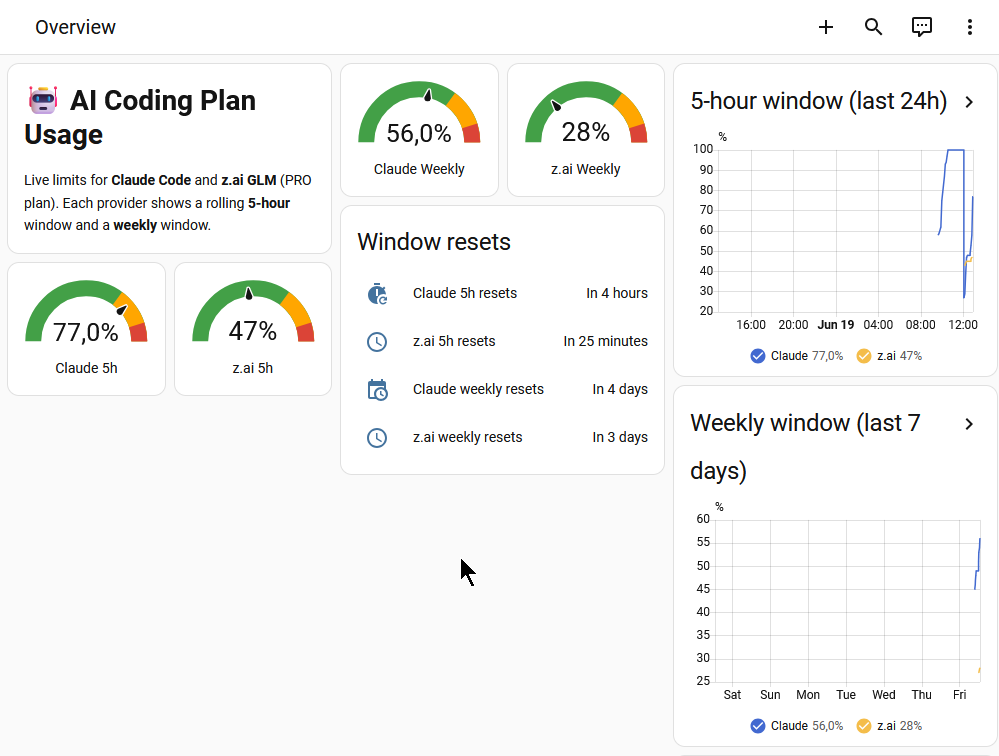
With sensors from both providers in Home Assistant, the dashboard itself is just a Lovelace layout — registered as a sidebar entry called “AI usage” so it is one tap away on mobile. The top of the screen is the part I actually use: two five-hour gauges side by side (Claude on the left, z.ai on the right), then two weekly gauges below them, each colour-coded green to yellow to red as it climbs toward the ceiling. A glance tells me whether I can start a long session on a given provider or should pace myself.
Underneath sit the reset times — “Claude five-hour resets in four hours”, “z.ai five-hour resets in twenty-five minutes” — which is genuinely useful information, because the windows refill on their own schedule regardless of what I do. Below that, two history graphs overlay the two providers over the last twenty-four hours and the last seven days, so I can see the shape of my usage, not just the current value. The full package — built-in Lovelace cards only, no HACS custom cards — survives Home Assistant upgrades without breaking.
I built the whole thing the same way I built the Home Assistant wall panel
and most of my other recent projects: I wrote down what I wanted, then worked through it with Claude Code doing the reverse-engineering and YAML writing while I reviewed every line and tested each piece against the live responses. The hardest part — figuring out the unit field and accepting that I could only get percentages — was debugging, not typing.
Lessons learned#
The unit field was a good reminder that an API can return HTTP 200 with perfectly plausible values and still be quietly wrong. When two things look identical in a response, the thing distinguishing them is usually a field you would never guess from the name. Always validate against a known state — in this case, comparing the sensor reading to the number shown in the VS Code extension — before trusting it.
The other lesson is about choosing the metric that answers your question, not the one that looks thorough. A raw token total reads as more data, but the only question that ever mattered was am I about to be throttled? — and that is a percentage of the ceiling, not a count. Picking the number that maps to the decision you actually make is the difference between a dashboard that is useful and one that is merely decorated.
And polling a rate-limited usage API is itself a way to get rate-limited. The integration that is supposed to tell you when you are near your limit can, if you are careless, push you over a different one. Five minutes. Always.
The payoff is exactly what I wanted. My phone now tells me, at a glance and without opening anything, whether I should start a long coding session on Claude or z.ai, how much headroom I have on each, and when the windows refill. The friction of not knowing is gone.
Resources#
- Home Assistant — open source home automation, where this dashboard lives
- HACS — the Home Assistant Community Store, for the Claude usage integration
- ccusage-mqtt — publishing Claude Code usage as MQTT sensors (the Claude half of this dashboard)
- z.ai — the GLM Coding Plan (the other half)
- Beyond ChatGPT: Building Your Own AI Toolkit — why I run both plans and how z.ai’s API works
- Turning a Cheap Yellow Display into a Home Assistant Control Panel — another Home Assistant dashboard project
- My custom Claude Code setup — how the statusline usage script that started all this fits together